![]()
![]()
![]()
The Demand Curve
The relationship between price and the amount of a product people want to buy is what economists call the demand curve. This relationship is inverse or indirect because as price gets higher, people want less of a particular product. This inverse relationship is almost always found in studies of particular products, and its very widespread occurrence has given it a special name: the law of demand. The word "law" in this case does not refer to a bill that the government has passed but to an observed regularity.1
There are various ways to express the relationship between price and the quantity that people will buy. Mathematically, one can say that quantity demanded is a function of price, with other factors held constant, or:
Qd = f(Price, other factors held constant)
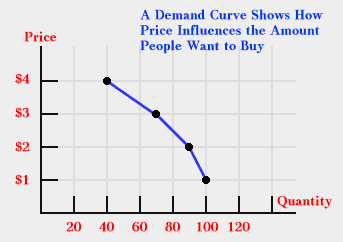
A more elementary way to capture the relationship is in the form of a table. The numbers in the table below are what one expects in a demand curve: as price goes up, the amount people are willing to buy decreases. (A widget is an imaginary product that some economist invented when he could not think of a real product to use in an example.)
Widgets |
People Want to Buy |
The same information can also be plotted on a graph, where it will look like the graph below.2
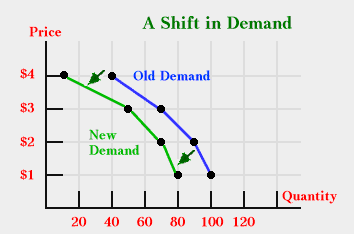
If one of the factors being held constant becomes unstuck, changes, and then is held constant again, the relationship between price and quantity will change. For example, suppose the price of getwids, a substitute for widgets, falls. Then, people who previously were buying widgets will reconsider their choices, and some may decide to switch to getwids. This would be true at all possible prices for widgets. These changes in the way people will behave at each price will change the demand curve to look like the table below.
|
|
|
Widgets |
People Want to Buy |
These are the same changes shown in a graph.
1 Maybe there really is no law of demand. See the discussion and links at http://gregmankiw.blogspot.com/2007/07/real-world-giffen-good.html
2 To follow mathematical convention, quantity should be on the vertical axis since quantity depends on price. But Alfred Marshall put price on the vertical axis when he developed the modern treatment of supply and demand in 1890, and his way has become tradition.
Copyright Robert Schenk