Efficiency and Markets II
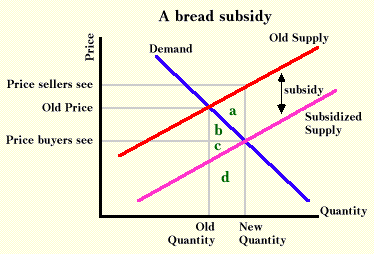
Suppose that the government decides to help consumers by lowering the price of bread with a subsidy to sellers. The graph below indicates the effects of this policy. The subsidy makes the price of bread look higher to sellers, and they produce more. It makes the price look lower to buyers, and they buy more. Because both buyers and sellers would appear to be happy with this result, can we conclude that this subsidy helps the economy? The answer is a surprising "No."

The key to seeing why the subsidy does not increase value is to realize what scarcity implies. The production of more bread requires more resources, and these resources must be drawn from other uses. To get the extra bread, consumers must do with less of other goods.
In the simple model illustrated above, the value and cost of the extra bread can be measured. The value of the extra bread is the amount that people are willing to pay for it. Consumers were not willing to buy the extra bread at the old price, so it must be less valuable to them than the old price. It will, in fact, be equal to the extra area under the demand curve, or area b+c+d in graph above.
Production of this extra bread requires resources that have more value than the value of the extra bread. Marginal cost is the value that must be paid to resources in order to produce one more loaf of bread, and this value exceeds the value of the loaf with the subsidy. The extra cost will be the area under the old supply curve, or area a+b+c+d. The subsidy causes businesses to take valuable resources and to transform them into less valuable output. There is a waste in this process, and the triangular area a measures this waste. Economists call this area welfare loss.1
Although bread subsidies are wasteful, they can be politically popular. People see the good side of the subsidy--the cheap bread. What they usually do not understand is the bad side of the subsidy. They do not realize that the higher prices of other goods can be related to the low price of bread. An economic system is a complicated system, and many of the cause-effect relationships take a good deal of abstract thinking to comprehend.
If a government subsidy increasing the amount of bread does not help consumers, perhaps a contraction of the amount of bread will. The discussion of consumers' and producers' surpluses suggested that producers or consumers could gang up on the other and transfer surplus. Suppose that bread buyers unite and restrict purchases of bread. This union, which changes our assumption of price taking, will force down the price of bread.
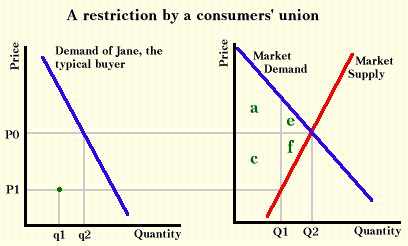
The graph below illustrates the story of the consumers' union. For the union to be successful, each buyer must restrict purchases as Jane does in the graph. Consumers as a whole will be better off as a result of this action because consumers' surplus will rise. Prior to the union, consumers' surplus will be a+e on the graph, but after the price reduction, it will be a+c. As long as area c is greater than area e, the consumers' union benefits consumers.

However, the union does not benefit society as a whole because the Martha Smiths are as much members of society as are the Jane Does. The consumers are better off only because they have seized value that was already there, captured by the producers. But in the process of making this transfer, value equal to areas e+f was lost.
Furthermore, there are changes that could improve consumer well-being. If consumers could continue to buy Q1 at price P1, they would be willing to buy additional loaves at a higher price. Another loaf has greater value to them than the resources needed to make it. If they could keep the low price of P1 for quantity Q1 and then pay extra for additional loaves, they could capture some of the wasted value. By restricting bread production, resources have shifted from bread production to other uses that are less valuable to society than the value of foregone bread.
The unexploited value that the consumers' union creates would be tempting for each individual, and it is unlikely that such a union of many buyers could exist long because of the free-rider effect. In practice the same result is obtained by requiring the farmer to sell grain to the government at a price below market equilibrium. The bread price is kept low by a system of rationing, either by queuing or coupon. Such systems are fairly common throughout the world whenever bread consumers have more political influence than peasants.
The two graphs above use a way of looking at economic efficiency that helps some people understand the concept. A situation is economically efficient when the sum of consumer and producer surpluses is as large as possible. Because any move that reduces that sum decreases value, it results in economic inefficiency.
Discussion of the welfare loss caused by bread subsidies and by requirements that farmers sell their products to the government at prices below world market prices is not just of academic interest; such policies are widespread and ancient. Rome had bread subsidies almost 2000 years ago. More recently, various forms of bread subsidies and price ceilings existed in the Soviet Union, some of the countries of Eastern Europe, and parts of Africa. The price of bread can be kept so low that governments must pass laws prohibiting farmers from feeding their livestock bread rather than grain, a temptation only when the price of bread is less than the price of the grain used to make it.
This section has shown that it is fairly simple to construct a model in which markets allocate resources in a way that maximizes value. However, the reader should understand that other results can occur with alternative assumptions. Showing that markets in an imaginary world result in economic efficiency does not tell us that markets in the real world do, but only that they might.2
1Not all changes in behavior represent welfare loss. If a change makes John richer and Joe poorer, Joe will consume less but his lower welfare may be entirely offset by John's gain. Changes in behavior due to changes in income are ignored in discussing welfare loss. Only those changes that are substitution changes, in which a person does more of one thing and less of another because of changes in relative prices are counted as a welfare loss. As a result, using regular demand curves to measure welfare loss may result in an error. Instead, a special demand curve, one that captures only substitution effects, is the proper demand curve to use when drawing triangles of welfare loss. In many cases, the difference will be very small, but check an intermediate-level textbook under the topic of "income-compensated demand curves" for more information.
2The conclusions of this section can be shown more elegantly and precisely using mathematical methods. But there is a cost to a mathematical presentation--it requires sophisticated mathematics. The previous discussion above tries to give the same insights in a more intuitive manner.
Copyright Robert Schenk