Efficiency of an Excise Tax (II)
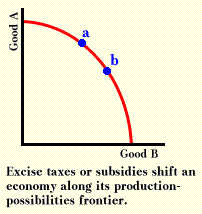
In the last section, we saw how we could see the welfare cost of an excise tax using a supply and demand graph. Another way of illustrating the loss of value that an excise tax can cause is with the production-possibilities frontier in the graph below. Suppose that initially the society is at point a and that this point is economically efficient. Now suppose that the government collects revenue by placing a tax on good A but not on good B and then returns it to the citizens. The introduction of the tax will reduce the amount of good A that people will buy relative to the amount of good B because, with the tax, the price of A has risen relative to B. Hence, people will shift from point a to point b on the graph. But point a was economically efficient--not point b.

The price system is a method of communicating information. The system works efficiently only when the information that is communicated is accurate. Taxes can distort the signals that prices carry so that they no longer correctly describe the costs and benefits that various decisions have for society as a whole. Hence, they can distort decisions as well.
Note that the welfare costs of a tax are not the same as the resources that the government uses to collect revenue or the resources that the private sector uses to comply with the tax laws. These are costs in addition to the welfare cost of taxes illustrated above.
The analysis up to this point has avoided complications. In fact, there are at least three complications that one must consider before one tries to draw any conclusions about the actual effect of an excise tax in the real world.
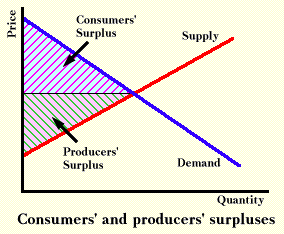
First, the first graph is drawn with a horizontal supply curve, implying that resources used to produce the product are all equally productive in producing the item. Often, resources are not identical. For example, in producing grain, some land is much more productive than other land. If the price of grain drops, land that is least productive will usually be switched to pasture land or left idle. As the price continues to drop, the land that is taken from production will continue to be the "marginal" land, or that which is least productive (relative to other uses). This pattern of resource productivity will yield an upward-sloping supply curve such as that in the graph below. The hatched area above P1 and below the demand curve is consumer surplus. The hatched area under P1 and above the supply curve is producer surplus.

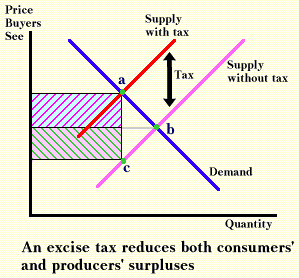
If an excise tax is imposed in a market such as that illustrated above, the graph below results. In this case, the price rises less than the amount of the tax, and tax revenue--the total hatched area--exceeds the loss of consumers' surplus. But there is another loss, one of the producers' surplus. Economic rents are diminished. The total reduction of surpluses will exceed the tax revenue by the amount of the triangular area a-c-b. Hence, an upward-sloping supply curve does not change the conclusion that the tax causes economic inefficiency, though it does alter the conclusion about who bears the tax.

A second complication to our story is that for some cases a simple supply and demand graph may not be appropriate to examine the consequences of a tax. Using a supply and demand graph to analyze a tax is a case of partial equilibrium analysis. Such analysis assumes that any effects on other markets can be ignored. Sometimes this assumption may be inappropriate. A tax on item A may affect the price of item B, which in turn may alter the supply or demand of item A. When this sort of situation occurs, economists can attempt to analyze it with a much more complicated technique of general equilibrium analysis, a topic best left to advanced courses in economics.
A third complication of the economic efficiency of a tax is that up to now we have been assuming that we started from a position of economic efficiency. If the starting point is not economically efficient, the distortion that the tax causes may offset some initial distortion, and, as a result, the tax can increase economic efficiency rather than reduce it.
We will finish this group of readings with rent seeking.
Copyright Robert Schenk