Aggregate Demand and Aggregate
Supply
ISLM aggregates the economy into a market for money balances, a market for goods and services, and a residual market that it ignores by invoking Walras' Law. Since part of the residual market is the labor market, and because adjustment in this market is slow, ISLM would be a better model if it could capture what is happening in the resource markets. Aggregate supply-aggregate demand analysis makes this incorporation.
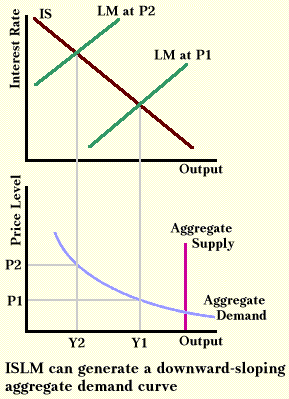
The aggregate demand curve is derived from the ISLM model. In the illustration below, equilibrium income is Y1 when the price level is P1. Let the price level rise to a higher level, from P1 to P2. At the higher level, with a constant amount of money, purchasing power is cut. The fixed number of dollars no longer buys as much. The effects on the LM curve are identical to what happens when prices remain fixed and the amount of money falls. The LM curve, in either case, shifts left, interest rates rise, and income falls. The output levels at both P1 and P2 are shown in the bottom part of the illustration. The aggregate demand curve connects them with points that other price levels generate.

The aggregate supply curve comes from the resource market. Though these markets may adjust slowly, when they finally do fully adjust, price level should have little or no effect on the amount of resources supplied. If a doubling of all prices and wages results in more or less output, someone is suffering from money illusion. The person believes either that he is better off at a higher nominal (but same real) wage, or that he is worse off with higher prices that have been fully compensated with higher wages. If people realize that money is merely an intermediary, and ultimately goods trade for goods, price level should not matter.
The point of the last paragraph is important enough to explain in a more concrete manner. Suppose Edward has a paper route and at the end of each week his income is $25.00. He spends his entire income on 15 hamburgers that cost $1.00 each and 20 soft drinks that cost $.50 each. One day Edward wakes up and finds that his weekly income has doubled to $50, but all prices have also doubled. Is he any better or worse off? Clearly he is not. A week of delivering newspapers still trades for 15 hamburgers and 20 soft drinks. He has no reason to work either more or less.
If behavior does not change when price level does, output will not depend on price level. The result will be the perfectly vertical aggregate supply curve shown in the illustration above. In the long run, when prices and wages fully adjust to any change in total spending, resources and output determine output.
In the short-run, however, an adjustment process that is not instantaneous seems more appropriate. Prices can be sticky, especially in resource markets. Expected rates of inflation can affect the way prices are set. Once we allow these possibilities, we have a system in which it may take years to reach long-run equilibrium. It is even possible that the system will never reach equilibrium, but, as the business-cycle writers thought, will fluctuate forever in the adjustment process.
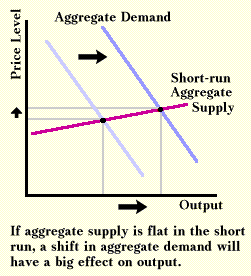
Once we add stickiness to prices and give a role to expected inflation, a change in spending will not simply move the economy up or down a vertical aggregate-supply curve. The upward-sloping curve below shows what is likely in the short run. A change in spending will move the aggregate-demand curve. If the short-run aggregate-supply curve is fairly flat, there will be a large change in output and a small change in price level.

Aggregate supply and aggregate demand is an attractive framework because it is simple, with the same structure as supply and demand. However, the assumptions behind aggregate supply and aggregate demand are totally different from those behind supply and demand, that is, aggregate supply and aggregate demand curves are not obtained by adding up all the supply and demand curves in an economy. If they were, one would expect that the long-run aggregate-supply curve would be flatter than the short-run aggregate-supply curve, as is the case with a normal supply curve. But the aggregate supply curve grows steeper the longer the time for adjustment.
Aggregate supply and aggregate demand is more general than ISLM, and overcomes some of the limitations of ISLM. It includes price level as a variable, and it shows that resource markets matter. It also lets one consider cases in which disturbances originate in a resource market, such as a disruption of oil supplies, which ISLM cannot handle.
Aggregate supply and aggregate demand gives insight into the adjustment process. Observation of the real world tells us that when spending suddenly changes, output changes initially more than prices, and only after considerable delay do prices change more than output. Aggregate supply and aggregate demand yields this pattern.
Aggregate demand and aggregate supply show an adjustment process. It does this with a series of short-run equilibria. Alfred Marshall originated this technique with regular supply and demand. He had three periods: the market period or the very short run, in which output was fixed; the short run, in which capital was fixed but utilization of capital was not; and the long run, in which nothing was fixed. So far the expositions of aggregate supply and aggregate demand have been fuzzy about what is fixed in the short run that is not fixed in the long run. This fuzziness remains as a problem of aggregate demand and aggregate supply.
Copyright Robert Schenk