Problems: Continuous Probability
Distributions
1. There are very few continuous distributions that we can do much with without a lot of math, but the simple uniform distribution is one of them. A uniform distribution is one that is just that--uniform. If we imagine any possible number between 0 and 2 as equally likely, we have an infinite possible number of numbers, so the probability of any particular number is close to zero. Instead of focusing on particular numbers, we have to focus on intervals.
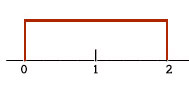
The probability that some number between zero and two will come up will be one. To find the probability of any interval, we find the length of the interval and multiply by .5. Hence, the probability of getting a number between zero and one is .5.
For the following, draw the picture and compute the probabilities. What is:
- a) P(0<x<.8)
- b) P(x>.8)
- c) P(.5<x<1.5)
- d) P(.5<x<1.2) or P(.8<x<1.3)
- e) compute the probability that we will not be in the interval of .4 to 1.5.
- f) compute the middle interval in which we will be 90% of the time.
- g) compute the tails (outside intervals) that we will be in 5% of the time
2. The picture below shows a continuous probability distribution with the formula, y=.5x for the range, x=0 to x=2. In this case, area is probability.

- To compute the probability of being between 0 and 1, for example, you need to know y when x equals 1. The formula says it is .5. Hence, to find the probability that x is between 0 and 1 Prob(0<x<1), we compute the area of the triangle with a length of 1 and a height of .5. The answer is .25 because .5HW = .5*.5*1.
- a) Show that the area under the line is equal to 1.
- b) Find the following probabilities:
- Prob(0<x<.5)
- Prob(0<x<1.5)
- Prob(1.5<x<2)
- Prob(.5<x<1.5)
- Prob(x<.5 or x>1.5)
- c) Suppose that we draw twice from this distribution and that probability of the second draw is independent of the first. What is the probability of getting greater than 1.5 on both draws? What is the probability of getting less than 1.5 on both draws? What is the probability of getting a result greater than 1.5 on one draw and less than 1.5 on the other draw?
3. Here is another continuous probability distribution for which we can work the problems without using complex math or tables. The range of possible outcomes is from zero to 1. The probability density function is y=2x. The probability histogram looks like this:

If you remember geometry, you can find the area of any interval using the formula for a triangle, which is .5(H*W) (one half height multiplied by width). We can find the height at any spot with the formula y=2x, where y is the height and x is the distance out on the x-axis. The total area under the triangle is 1, which it must be.
- Find the following probabilities:
- P(0<.5)
P(.5>x>1)
P(.2<x<.7) - Find the interval so there is a 5% chance of being below the interval and a 5% chance of being above it.
4. A uniform distribution that has a range from 0 to 4 and that is continuous would look like the picture below. Probability is area.
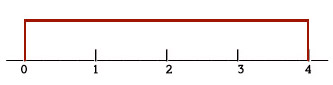
Find:
- (0 < P(x) < 4) = ________
- (P(x) > 1) = ________
- (P(x) = 1) = ________
- (P(x) < 1) = _________
What is the expected value of x? (You cannot do the math, but you should be able to see it.)