Problems: Multivariate Regression
2
6. Below is a passage from the book Fringe Banking: Check-Cashing Outlets, Pawnshops, and the Poor by John P Caskey (New York: Russell Sage Foundation, 1994). The numbers in parenthesis under the Estimated Coefficients are t-values. (A dummy variable takes values of 0 or 1—it means that a variable can be coded as on or off.) Click on the image to get a larger version.

- a. The author is trying to explain why some states have more pawnshops per capita than other states have. How successful is he in explaining this?
- b. He lists four hypotheses about the signs he expects on the coefficients. One of them is contradicted. Which one? Explain.
- c. Which of his hypotheses is most strongly supported by his results? Explain.
7. Use this information to answer the questions below. (Click on the image for a larger version.)
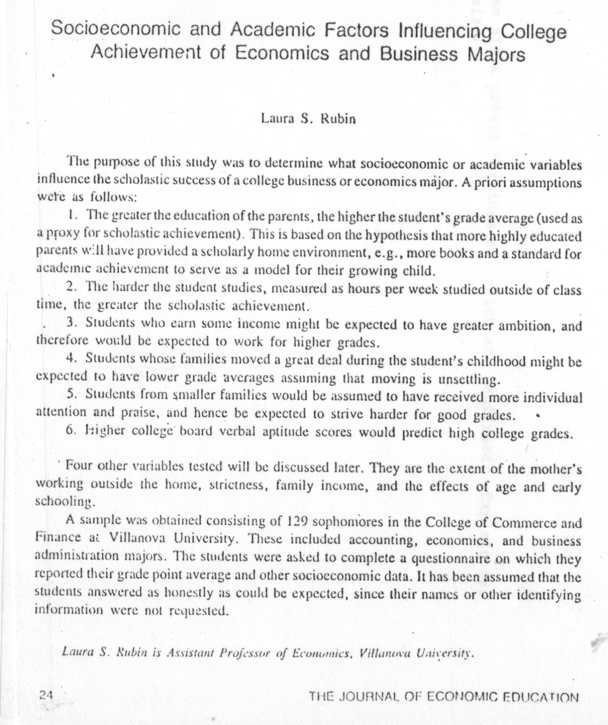

- a) Would this equation be useful for prediction purposes? Why or why not? (Us the R2 in your explanation.)
- b) Why is the t-value under EF (education of father) not significant at the .05 level?
- c) What would the standard error of the regression coefficient for S (hours of study) be? (You have to compute it from the information given.)
- d) What does the negative sign in front of the regression coefficient of M (number of moves during childhood) indicate?
- e) The author has six a priori hypotheses. Which are confirmed? Explain for each hypothesis.
8. The authors of a study in the Canadian Journal of Economics in the Spring of 1975 wanted to examine the factors responsible for learning among principles-of-economics students. The variable they were trying to explain, the amount a student had learned, was measured by a score on the test at the end of the semester. Some of the independent variables that the authors used are self-explanatory and were presumably obtained from student records. The authors also gave a test at the beginning of the year, called the pre-test, which was meant to measure a student's initial knowledge of economics. Other information was obtained from a questionnaire given the students that asked their evaluation of the usefulness of the course, their rating of the teacher (was he interesting? organized?), the number of classes they attended, and the time they spent on the course. These were all rated on a one-to-five scale.
Below is the regression equation that the authors estimated (t-values are in parentheses):
|
Test Score = |
-2.91 + |
.350 H.S.grades + |
0.0184 V&M_SAT_Score |
+ .375 pretest |
|
(-0.41) |
(3.77) |
(4.08) |
(7.08) |
|
|
- 4.86 girl - |
1.87 yr in school |
- .32 Q stimulating + |
1.02 Q organized |
|
|
(-3.65) |
(-1.78) |
(-0.50) |
(1.32) |
|
|
+ 1.88 Q useful |
+ 0.21 attendance |
- 1.54 time spent |
||
|
(2.79) |
(0.29) |
(2.55) |
||
|
R2 = .44 |
||||
9. What factors seem to be important in determining the amount a typical student learned? Which may not be important? Does the small size of the regression coefficient on the verbal-math SAT score mean that this was not important? What else do you conclude?
Below are the regression results that a student obtained when he sought to explain the number of runs baseball players scored in a year by considering their hits, homeruns, and stolen bases.
|
Dependent variable is runs scored |
|||
|
Independent |
Regression |
Standard Error |
t-Value |
|
Constant |
-7.4232 |
12.2636 |
-0.605 |
|
Hits |
0.0464 |
0.0972 |
4.772 |
|
Homeruns |
0.5359 |
0.2496 |
2.147 |
|
Stolen Bases |
1.4040 |
0.5327 |
2.786 |
|
Standard error of estimate: 10.705; Number of
observations = 25 |
|||
- a) How well do the independent variables explain the dependent variable? Explain what number(s) you use to decide this.
- b) If a player had 60 hits, 5 home runs, and 10 stolen bases, how many runs could we expect him to score?
- c) Construct a 95% confidence interval for the true regression coefficient of stolen bases.
- d) What does the 4.772 mean in the t-value column?
- e) There are a number of things that are questionable with the way the student has set up this study. For example, we are estimating a regression coefficient for home runs, but we actually know what it should be. What is it? All of these regression coefficients may be capturing the influences of variables that are not included in the study, especially the number of at bats a player had. How might you improve this study if you were to start over?
10. A large company divides its market into a number of districts. It is interested in knowing how sales in these districts depend on the population and on the amount spent on advertising. Using least squares regression, it finds
where Y is sales in millions of dollars
Y = 10.7 +
0.4X1 +
4.2X2
| n = 18 districts
(0.15)
( 2.0)
| R2 = .76
X1 is population in hundreds of thousands
X2 is the amount spend on advertising in millions of dollars
numbers in parentheses are standard errors of the regression coefficients
- a) Explain what the regression coefficients mean.
- b) Compute the t-values for the regression coefficients and explain what they tell us.
- c) What does the R2 tell us?
- d) If you wanted to test the hypothesis that the true value of the R2 is zero, that is, that this regression explains nothing at all but whatever we are seeing is just chance, what value would you want to have?
11. A regression uses 100 observations to determine the relationship between the GPA of freshmen and their SAT test scores. It gives the following equation:
GPA = 1.43 +
.0004(Math SAT) +
.0018(Verbal SAT)
(.00015)
(0004)
The numbers in parentheses are the standard errors of the regression coefficients. Test the hypothesis that the population regression coefficient for Math SAT is equal to zero (which is the hypothesis that there is no effect of Math SAT scores on GPA).