Skewness
Measuring the center and the dispersion of a data set is an attempt to simplify the information in the set to only two numbers. Often this extreme simplification is highly useful. However, sometimes we need to be aware of a third characteristics, the lopsidedness of the data. The statistical term for lopsidedness or asymmetry around the mean is skewness.
Problems: Skewness
1. A box contains these five tickets:
0, 0, 0, 0, 5
a) What is the average of the box?
b) What is the standard deviation of the box?
c) Does the box have a median? If so, what is it?
d) Does the box have a mode? If so, what is it?
e) Is this set of numbers symmetrical or asymmetrical? If it
is asymmetrical, does the tail extend to the right or to the
left?
2. Pearson's coefficient of skewness is 3*(mean-median)/(standard deviation).
- a) Compute it for these numbers: {0, -1, 10, 7, 2, 2,
1}.
Is this distribution symmetrical, or does it have a tail to the right or to the left? - b) Compute it for these numbers: {-6, 19, 0, 8, 1, 2,
4}.
Is this distribution symmetrical, or does it have a tail to the right or to the left? - c) Do the same with {17, 18, 20, 21, 40, 33, 27, 23, 21}.
- d) What is the logic behind this measure? Why subtract the median from the mean? Why divide by the standard deviation?
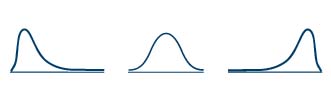
3. The U.S. Geological Survey keeps track of river flow throughout the United States. One of its tracking stations is just east of Rensselaer, Indiana and on a January 22 a few years ago it reported that the flow of the mighty Iroquois River was 445 cubic feet per second. Looking at the past 55 years, the lowest flow was 11 cubic feet per second, and the highest on record was 1670 cubic feet per second. The average on January 22 for the previous 55 years was 193 cubic feet per second, while the median flow was 105 cubic feet per second.
Based on this information, if we graphed the data from the these 55 years on how much water was flowing in the river, which of the following graphs would be most like the one that we would obtain. Explain how you get your answer.
4. If a distribution is skewed to the left (meaning it has a long tail to the left), which is greatest: the mean, median, or mode? Which is smallest?
5. After handing back a test a professor noted that the distribution of scores was positively skewed. On leaving class, one of your friends who has never had statistics turns to you and says, "Even the prof thought that this test was rotten. He said was positively screwed up." How would you explain to your friend what the professor really meant?