Buyer and Seller Equilibrium
We have developed the model of supply and demand as an equilibrium model. We have said nothing about how adjustments from disequilibrium to equilibrium take place. To develop this idea, it is useful to take still another view of supply and demand curves, to view demand as points of buyer equilibrium and supply as points of seller equilibrium.

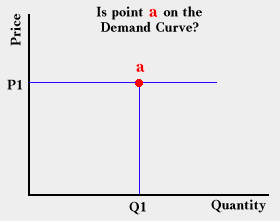
Suppose that price is at P1 in the graph above. Will point a be a point on the demand curve? If people would like to buy more than Q1 at price P1, point a must lie to the left of the demand curve. In this case, some consumers are unhappy with the amount they have purchased and will try to purchase more. If there is no more to purchase, some will attempt to offer more money for the product or they will increase the time they devote to getting the product. The important idea is that if point a lies to the left of the demand curve, people will be unhappy with their situation and will change their behavior. If point a lies to the right of the demand curve, people will decide that they are buying too much of the product and will cut purchases. In conclusion, if a position is not on the demand curve, people will change their behavior, which indicates that only positions on the demand curve are positions of buyer equilibrium.
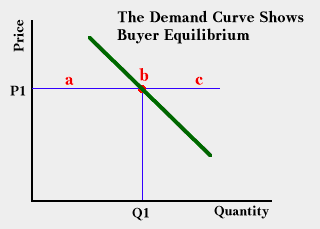
Similar reasoning explains why the demand curve can be considered a boundary. In the graph below, buyers are not in equilibrium at point a, but they can be held there and made to adjust in ways that do not change the money price. They cannot be held at point c unless there is some way to force people to buy a product when they do not want it.

Point b in the graph is a position of buyer equilibrium because, given price P1, people will be satisfied with Q1 and will do nothing to change their behavior. Buyers would, of course, prefer a lower price than P1—they are always willing to move down the demand curve. However, this is not the issue here. Given P1, Q1 is the preferred quantity.
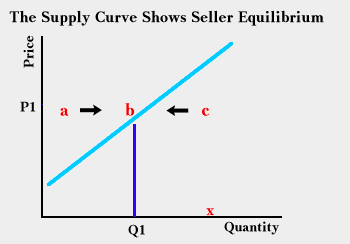
Just as the demand curve shows positions of buyer equilibrium, the supply curve shows positions of seller equilibrium. At point a in the picture below, suppliers find that they could increase profits (or reduce losses) by moving to the right to a larger quantity. If they could not increase profits by moving toward the right, they would stay at point a. Because they do not, they are not in equilibrium and on the supply curve but to the left of it. If they find that they could increase profits by cutting production, they are to the right of the supply curve and out of equilibrium. There is a quantity at the price P1 that maximizes profits and toward which sellers will adjust. This point, shown as b in the picture, is on the supply curve.

It is possible to force sellers to a position left of the supply curve. This is the case in which sellers would like to sell more at the given price, but for some reason can not. One reason might be that the buyers will not buy as much as the sellers would like to sell. It is virtually impossible—short of slavery—to force sellers to the right of the supply curve. If sellers are selling more than they want to at the given price, they can simply stop selling. Thus, the supply curve represents a boundary facing the buyers. If buyers could force sellers to the right of the supply curve, they would find it advantageous to force sellers to a position such as x in graph above, which represents getting something for nothing.
Sellers prefer higher prices to lower prices. Although all points on the supply curve represent points of equilibrium, not all are equally preferred by sellers. Sellers are always happy to move up along a supply curve.
Copyright Robert Schenk