The Supply Curve
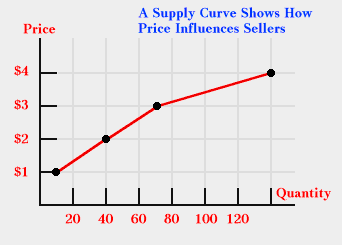
The relationship between the quantity sellers want to sell during some time period (quantity supplied) and price is what economists call the supply curve. ALThough usually the relationship is positive, so that when price increases so does quantity supplied, there are exceptions. Hence there is no law of supply that parallels the law of demand.
The supply curve can be expressed mathematically in functional form as
Qs = f(price, other factors held constant).
It can also be illustrated in the form of a table or a graph.
| A Supply Curve |
Price of
Widgets |
Number of Widgets
Sellers Want to Sell |
| $1.00 |
10 |
| $2.00 |
40 |
| $3.00 |
70 |
| $4.00 |
140 |
The graph shown below has a positive slope, which is the slope one normally expects from a supply curve.

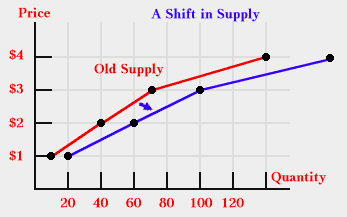
If one of the factors that is held constant changes, the relationship between price and quantity (supply) will change. If the price of an input falls, for example, the supply relationship may change, as in the following table.
| A Supply Curve Can Shift |
Price of
Widgets
|
Number of Widgets
Sellers Want to Sell
|
| $1.00 |
[10] becomes 20 |
| $2.00 |
[40] becomes 60 |
| $3.00 |
[70] becomes 100 |
| $4.00 |
[140] becomes 180 |
The same changes can be shown with a graph that shows the supply curve shifting to the right. Notice each price has a larger quantity associated with it.

  
Copyright Robert Schenk
|

