|
|
|
||||||||||||||||||
|
|
||
The table shows that if expected income rises by $2,000, from $10,000 to $12,000, people will increase their spending by $1,500, or that they will only spend three-fourths of additional income that they expect to receive. This fraction of additional income that people spend has a special name, the marginal propensity to consume (or mpc for short). In the table above the mpc is always three-fourths. Thus if income increases by $8000, from $12,000 to $20,000, people increase spending by $6,000, from $14,000 to $20,000.
The marginal propensity to consume can be computed with the formula:
(1) MPC = (change in consumption) divided by (change in income)
In addition, economists often talk of the marginal propensity to save, which is the fraction of additional income that people save. Since people either save or consume additional income, the sum of the marginal propensity to save and the marginal propensity to consume should equal one.
The value of the marginal propensity to consume should be greater than zero and less than one. A value of zero would indicate that none of additional income would be spent; all would be saved. A value greater than one would mean that if income increased by $1.00, consumption would go up by more than a dollar, which would be unusual behavior. For some people a mpc of 1 is reasonable, meaning that they spend every additional dollar they get, but this is not true for all people, so if we want a consumption function that tells us what people on the average do, a value less than one is reasonable.
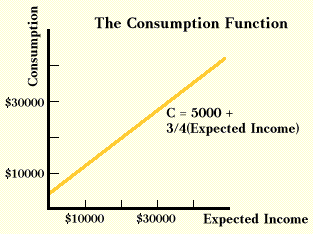
The consumption function can also be illustrated with an equation or a graph. The equation that gives the consumption function in the table above is:
(2) Consumption = $5000 + (3/4)(Expected Income).
If people expect an income of $10,000, this equation says consumption will be:
(3) Consumption = $5000 + (3/4)($10000) = $5000 + $7500 = $12500
which is the same result that the table contains. Notice that one can see the marginal propensity to consume in this equation. It is the fraction 3/4.
Graphing the consumption function presented above in the table and equation yields a straight line with a slope of 3/4 shown below. If the slope of the consumption function, which is the mpc, never changes, the consumption function is linear. If the mpc changes as income changes, then the consumption function will be a curved line, or a nonlinear consumption function. The $5,000 term in equation 2 is shown on the graph as the intercept, which indicates the amount of consumption if expected income is zero.

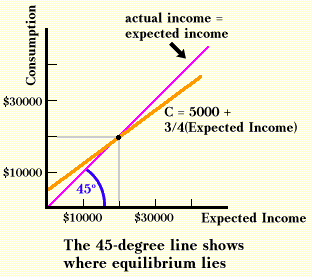
When will this model be in equilibrium? To answer this, recall that spending by one person is income for another. Because so far we have assumed that consumption is the only form of spending, the amount of consumption spending will equal actual income. If people expect income of $10,000 and spend $12,500, actual income will exceed expected income. It is reasonable to suppose that as a result people will change their expectations, and thus their behavior. The logical equilibrium condition in this model is that expected income should equal actual income.
In the table we see that $20,000 will be equilibrium income. When people expect income to be $20,000, they act in a way to make their expectations come true. We can show the solution on a graph by adding a line that shows all the points for which actual income equals expected income. These points will form a straight line that will bisect the graph, shown below as a 45-degree line. Equilibrium income occurs in the model when the spending line intersects the 45-degree line.

It is relatively simple to add business and government spending to this model.
Copyright Robert Schenk