The Budget Line
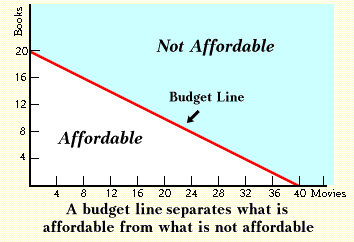
Rose Bole has only $100 to spend on her two passions in life: buying books and attending movies. If all books cost $5.00 and all movies cost $2.50 (these are simply assumptions to make the problem easier--as is the assumption that only two items are involved in the problem), the graph below shows the options open to Rose. The budget line is a frontier showing what Rose can attain. The budget line limits choices; it is due to scarcity. The cost of a book is $5.00 or two movies. Spending money on a product means that money cannot be used to purchase another product. In the case of books versus movies, the tradeoff is a straight line because one more book always costs two movies, regardless of how many books Rose has already.

You should be able to see that the slope of the budget line depends only on the price of books relative to the price of movies. If either books get cheaper or movies get more expensive, the budget line in the graph above will get steeper. If this is not immediately obvious, compute the possibilities open to a person with $100 to spend if books and movies both cost $5.00 (a case of more expensive movies), and the possibilities open to a person with $100 to spend if books and movies both cost $2.50 (a case of cheaper books). Graphing the possibilities open to a person with only $50 to spend but with books costing $5.00 and movies costing $2.50 gives you a line that is to the left of the line in the graph above, but parallel to it, which means that it has the same slope. The amount of money available to spend does not determine the slope of the budget line; only the ratio of prices does that.
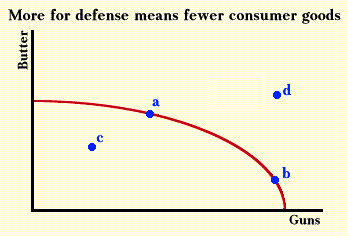
The budget line, which shows an individual's consumption possibilities, resembles another line that separates options that are attainable from those that are not, the production-possibilities frontier. Like the budget line, a production-possibilities frontier shows that scarcity implies tradeoffs. The guns vs butter tradeoff is perhaps the most famous example of these tradeoffs. During the Second World War the United States decided it needed to produce large amounts of armaments (guns). It shifted factories that previously produced goods for civilian use (butter) to the production of guns. This tradeoff could be represented as a move from a point such as a to a point such as b in the graph below, except that at the start of the war there was still a high level of unemployment left over from the recessions of 1929-33 and 1937-8 (a period better known as the Great Depression). Hence, the United States was not at the limit of what it could produce, but rather at a point such as c, which indicates that more of all goods could have been produced given the amount of resources and technology.

Although point d was a more desirable position than points a or b, it was unattainable given technology and resources. During World War II the cost of producing thousands of tanks and jeeps was the virtual elimination of production of autos for civilian use. The cost of feeding millions of troops in the field was a less attractive diet for the civilian population. The need to produce guns reduced the production of butter.
The major idea in this section has been that all economic activity takes place within limitations or constraints. Because of these constraints, choosing results in sacrificed options. The options that are not taken, which sometimes are easily measured in monetary terms, are costs.
Next, we combine the utility function and budget line.
Copyright Robert Schenk