Combining IS and LM Curves
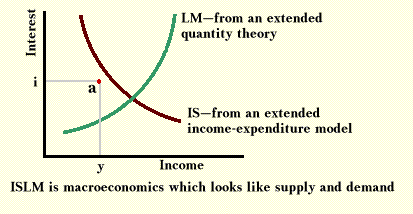
Having found the IS and LM curves, we do the expected: we place them together on the same graph. Only at the intersection of the two curves are both the goods market and the money market in equilibrium. At any other point at least one of the markets is out of equilibrium. Consider point a in the graph below. At point a the interest rate is higher and expected income is lower than the equilibrium levels. With the higher interest rates people want to hold less money than they do at the equilibrium level of interest, and at the lower expected income they also want to hold less money than they do at the higher equilibrium income. Thus there is more money in circulation than people want to hold-- an excess supply of money. As a result, people will try to get rid of surplus funds, or in the jargon of economists, they will try to adjust their portfolios. They can spend the money, or they can buy financial assets, which will drive down interest rates and increase spending.

Now consider what is happening in the goods market at point a. At interest rate i people will spend more than they expect to receive and thus actual income will be greater than expected income. For income of Y to be equilibrium income, interest rates must be higher. Because actual spending will exceed expected spending, expected income should rise and the economy should move toward the IS curve. Some books call this situation a case of excess demand in the goods market. This case is more clear when the income-expenditure model is constructed in terms of actual income and planned expenditures. Then at point a planned expenditures will exceed actual output and inventories will be decreasing.
The IS and LM curves look and act very much as supply and demand curves do. Just as IS and LM can be interpreted as lines of partial equilibrium, so can supply and demand curves. The demand curve shows all the price-quantity points at which buyers are in equilibrium, and the supply curve shows all the price-quantity points at which sellers are in equilibrium. Market equilibrium exists when both buyers and sellers are in equilibrium, which only happens where the curves intersect. One also can show by shifting the curves how changes in factors held constant will affect the equilibrium levels of the variables on the axis.
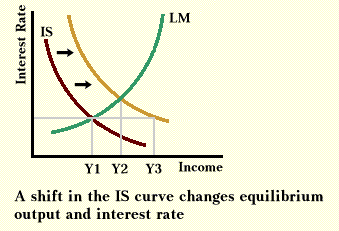
Examining the way the ISLM model is constructed reveals that a change in fiscal policy alters only equations that are used to build the IS curve, and changes in monetary policy alters only equations used to build the LM curve. An expansionary fiscal policy will shift the IS curve to the right, increasing interest rates and income. An expansionary monetary policy will shift the LM curve to the right, increasing income but decreasing interest rates. The way in which one shifts these curves is exactly the same as how one shifts curves in the model of supply and demand.
ISLM reveals that financing can matter. It did not in the simple income-expenditure model, which assumed that financial markets imposed no limitations on the goods markets. The differences in these models can be seen in the graph below, where an increase in government spending shifts the IS curve to the right. The simple income expenditure model, in which there are no interest rates, would predict that income would increase from Y1 to Y3. In the ISLM model the shift in the IS curve increases the interest rate, and this increase crowds out some investment, at least partially offsetting the effects of increased government spending. The steeper the LM curve, the greater the crowding out that this model suggests.

Suppose this same increase in government spending were financed not by borrowing from the public, but by printing more money. In this case both the IS and LM curves would shift to the right. As a result, interest rates would not rise, investment would not be crowded out, and the increase in income would be much greater.
We can skip over a technical section that looks at some of the problems with ISLM and go next to a discussion of Aggregate Supply and Demand, the newest attempt to make macroeconomics look like supply and demand.
Copyright Robert Schenk