Problems: Correlation 1
1. A sociology student is examining the relationship between number of siblings and achievement in school. She has the computer calculate a correlation, and notices that under the correlation coefficient the computer has given the observed level of significance of .94. True or false and explain: She should conclude that this result does not look random and therefore it seems that the number of siblings affects school achievement.
2. An instructor is curious to see how the test scores of his students are related to the amount of homework they do. Homework scores depend only on whether or not the student completes the assignment, while test scores depend on the number of questions a student answers correctly. He performs a correlation between test scores and homework points and finds:
r = -.650; level of significance = .000; N = 42.
Which of the following should he conclude and why?
- a) Students who do poorly on tests tend to skip homework.
- b) Students who do well on tests tend to skip homework.
- c) There is no real relationship between how well students do on tests and how much homework they do.
3. "For boys, frequent weigh-ins didn't lead to weight gain, the study found. Boys who weighed themselves often were more likely than other boys to take unhealthy measures to control their weight, but the difference was too small to be considered statistically significant." These sentences are taken from a news report found on the Internet. Explain what the second sentence means in language that would be understandable to someone who has not had a course in statistics.
4. A correlation was run between age of students and their GPA and the results are shown below.
AGE
GPA
AGE
Pearson Correlation:
Sig (2-tailed):
N:1.000
50-.031
.829
50GPA
Pearson Correlation:
Sig (2-tailed):
N:-.031
.829
501.000
50
- a) What does the correlation in the above table tell you about GPA and age in this sample?
- b) What can you infer about GPA and age in the population? Explain.
- c) The sign of the correlation coefficient is negative. What does a negative sign indicate?
- d) Using the tables at the back of the book, how big would the correlation have to be before we could be confident that there was some meaningful relationship between age and GPA in the population? Explain.
5. A researcher interested in what characteristics were correlated with student use of computer-assisted lessons found a correlation of .4153 between the number of lessons a student took and the student's high-school grade-point average.
- a) How would you explain in words what this number tells us?
- b) The researcher computed a t-value of 4.7 with 104 degrees of freedom for this correlation. Can the researcher conclude with confidence that these lessons will tend to be used more by students with higher high-school grades? Explain.
6. We expect that as cars get older and have more miles, their value will decrease. We can check this expectation in a preliminary way with correlation. Taking a sample of Cadillacs listed for sale in the want ads of a large city paper, I fed their prices, ages, and mileage into a statistical computer program and got the following results:
|
PRICE |
MILES |
AGE |
YEAR |
||
|
PRICE |
Pearson Correlation: |
1.000 |
-.777 |
.870 |
870 |
|
MILES |
Pearson Correlation: |
-.777 |
1.000 |
.593 |
-.593 |
|
AGE |
Pearson Correlation: |
.870 |
.593 |
1.000 |
1.000 |
|
YEAR |
Pearson Correlation: |
870 |
-.593 |
1.000 |
1.000 |
- a) How many observations do I have?
- b) Why is the correlation between Year and Age -1.000?
- c) Why is the correlation between age and miles positive while the correlation between age and price negative?
- d) All the significance levels are .000. What does that tell us?
7. Suppose we are interested in the correlation between last year's income and this year's income for a group of people.
- a) If the correlation between last year's income and this year's income is one, does it follow that everyone in the group earned the same in both years?
- b) Suppose that the correlation between last year's income and this year's income is zero. If we know what people earned last year, will this information give us any help in predicting what their income is be this year? Explain.
- c) Suppose we get these data:
Person Income Last Year Income This Year A
$26,000
$26,000
B
$40,000
$20,000
C
$12,000
$36,000
D
$20,000
$20,000
E
$14,000
$27,000
- Would the correlation coefficient of these numbers be positive, negative, or zero? (You do not have to compute the correlation coefficient to answer this.) Explain.
- d) Suppose that people who earned a lot last year tend to earn a lot this year and people who earned little last year tend to earn little this year. However, there are a few exceptions, people who had a bad year followed by a good year or vise versa. What range of correlation coefficients would capture this association between last year's income and this year's income? Explain.
8. Otto Mobile collects data from 25 cars. He then computes a correlation between weight of the car and its gas mileage. The answer he arrives at is -1.4. Interpret.
9. Brandon Cumber takes 50 numbers from a table of random numbers. He calls the first 25 the X variables and the second 25 the Y variables and computes a correlation. Computing a t-value from the formula t=(r-0)/(standard error of p) he gets 2.102 with 23 degrees of freedom. He therefore claims that he has conclusively proven that either the procedure does not work as advertised or that the table of numbers is not random. Evaluate his claim.
10. Doyle Zirkle is certain that there is a relationship between the kind of clothes people wear and their personalities. He has heard that correlation is a way of measuring how strong relationships are so he asks you to help compute a correlation to prove that he is correct. Assuming you want to help him, what should you say or do?
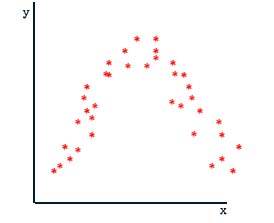
11. There is a relationship between X and Y on the graph below. However, the correlation coefficient will be close to zero. Explain why and illustrate on the graph.